OpenTelemetry in Production: The Definitive Guide to Unified Observability
on Opentelemetry, Observability, Devops, Monitoring, Distributed tracing

OpenTelemetry in Production: The Definitive Guide to Unified Observability
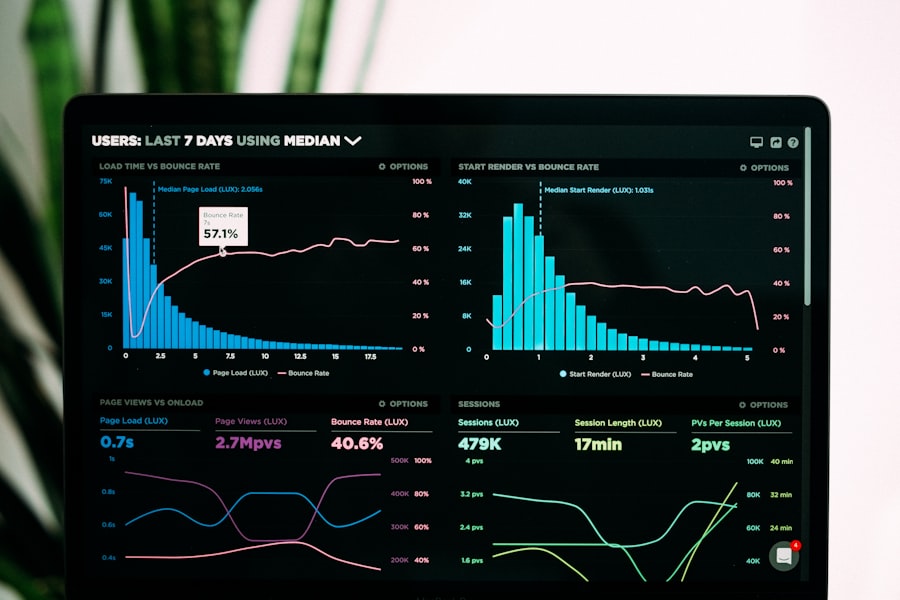
Observability used to mean picking a metrics vendor, a tracing vendor, and a log aggregation platform — then gluing them together with dashboards, cross-linking IDs manually, and praying the on-call engineer could correlate a spike in latency with a stack trace at 3 AM. OpenTelemetry (OTel) changes the equation entirely.
In 2026, OTel has reached full stability across all three signal types: traces, metrics, and logs. The ecosystem of SDKs, collectors, and backends has matured to the point where vendor-agnostic instrumentation is the only sane default for new projects.
What Is OpenTelemetry?
OpenTelemetry is a CNCF project that provides:
- A specification for how telemetry data should be structured and transmitted
- SDKs for 12+ languages (Go, Java, Python, Node.js, .NET, Rust, Ruby, PHP, C++, Swift, Erlang/Elixir, and more)
- The OTel Collector — a vendor-agnostic agent/gateway for receiving, processing, and exporting telemetry
- Auto-instrumentation libraries for popular frameworks (Spring, Django, Express, Rails, etc.)
The key insight: instrument once, export anywhere. Your code emits OTel-format signals; the Collector routes them to Jaeger, Prometheus, Grafana Loki, Datadog, Honeycomb, or whatever backend you prefer — or all of them simultaneously.
The Three Pillars, Unified
Traces
Distributed traces represent a single request’s journey across multiple services. OTel traces use the W3C TraceContext propagation standard, ensuring correlation headers flow correctly across HTTP, gRPC, Kafka, and other transports.
from opentelemetry import trace
from opentelemetry.sdk.trace import TracerProvider
from opentelemetry.sdk.trace.export import BatchSpanProcessor
from opentelemetry.exporter.otlp.proto.grpc.trace_exporter import OTLPSpanExporter

# Setup (usually done once in app init)
provider = TracerProvider()
provider.add_span_processor(
    BatchSpanProcessor(OTLPSpanExporter(endpoint="otel-collector:4317"))
)
trace.set_tracer_provider(provider)

tracer = trace.get_tracer(__name__)

def process_order(order_id: str):
    with tracer.start_as_current_span("process_order") as span:
        span.set_attribute("order.id", order_id)
        span.set_attribute("order.source", "api")

        result = fetch_inventory(order_id)  # child span created automatically
        span.set_attribute("inventory.available", result.available)
        return result
Metrics
OTel metrics support counters, gauges, histograms, and up/down counters. They integrate with Prometheus scraping OR push-based OTLP export.
from opentelemetry import metrics

meter = metrics.get_meter(__name__)

# Counter for request tracking
request_counter = meter.create_counter(
    "http.server.request.count",
    description="Total HTTP requests",
)

# Histogram for latency
latency_histogram = meter.create_histogram(
    "http.server.request.duration",
    unit="ms",
    description="HTTP request duration",
)

def handle_request(method: str, path: str):
    start = time.time()
    # ... handle request ...
    duration_ms = (time.time() - start) * 1000

    request_counter.add(1, {"method": method, "path": path})
    latency_histogram.record(duration_ms, {"method": method, "path": path})
Logs
The newest stable signal in OTel, structured log correlation ensures log records carry trace_id and span_id automatically — enabling you to jump from a trace waterfall directly to the associated log lines.
import logging
from opentelemetry.instrumentation.logging import LoggingInstrumentor

LoggingInstrumentor().instrument(set_logging_format=True)

logger = logging.getLogger(__name__)

def process_payment(payment_id: str):
    with tracer.start_as_current_span("process_payment"):
        logger.info(
            "Processing payment",
            extra={"payment_id": payment_id}  # trace_id injected automatically
        )
The OTel Collector: Your Telemetry Hub
The Collector is where the real power lives. A production Collector config handles:
receivers:
  otlp:
    protocols:
      grpc:
        endpoint: 0.0.0.0:4317
      http:
        endpoint: 0.0.0.0:4318
  prometheus:
    config:
      scrape_configs:
        - job_name: 'legacy-app'
          static_configs:
            - targets: ['legacy-service:9090']

processors:
  batch:
    timeout: 5s
    send_batch_size: 1000
  memory_limiter:
    limit_mib: 512
  resourcedetection:
    detectors: [env, system, docker, kubernetes]
  attributes:
    actions:
      - key: environment
        value: production
        action: insert

exporters:
  otlp/tempo:
    endpoint: tempo:4317
    tls:
      insecure: true
  prometheusremotewrite:
    endpoint: "http://mimir:9009/api/v1/push"
  loki:
    endpoint: http://loki:3100/loki/api/v1/push

service:
  pipelines:
    traces:
      receivers: [otlp]
      processors: [memory_limiter, resourcedetection, attributes, batch]
      exporters: [otlp/tempo]
    metrics:
      receivers: [otlp, prometheus]
      processors: [memory_limiter, resourcedetection, batch]
      exporters: [prometheusremotewrite]
    logs:
      receivers: [otlp]
      processors: [memory_limiter, resourcedetection, batch]
      exporters: [loki]
This single config:
- Receives OTel signals from your apps
- Scrapes legacy Prometheus endpoints
- Adds environment metadata to every signal
- Ships traces to Grafana Tempo, metrics to Mimir, logs to Loki
The Grafana LGTM stack (Loki + Grafana + Tempo + Mimir) is the dominant open-source observability platform in 2026, fully powered by OTel.
Auto-Instrumentation: Zero Code Changes
For many frameworks, OTel provides auto-instrumentation that requires zero changes to application code:
# Python with auto-instrumentation
pip install opentelemetry-distro opentelemetry-exporter-otlp
opentelemetry-bootstrap -a install

OTEL_SERVICE_NAME=my-api \
OTEL_EXPORTER_OTLP_ENDPOINT=http://otel-collector:4317 \
opentelemetry-instrument python app.py
This automatically instruments:
- Flask / Django / FastAPI / aiohttp
- SQLAlchemy / psycopg2 / redis-py
- requests / httpx / aiohttp client
- Celery / Kafka consumers
Kubernetes Deployment Pattern
The recommended production pattern in 2026 is deploying the Collector as a DaemonSet (one per node) for log and metric collection, plus a central Deployment for trace aggregation and routing:
# DaemonSet Collector for node-level telemetry
apiVersion: apps/v1
kind: DaemonSet
metadata:
  name: otel-collector-agent
spec:
  selector:
    matchLabels:
      app: otel-collector-agent
  template:
    spec:
      containers:
      - name: otel-collector
        image: otel/opentelemetry-collector-contrib:0.102.0
        env:
        - name: MY_NODE_NAME
          valueFrom:
            fieldRef:
              fieldPath: spec.nodeName
        volumeMounts:
        - name: varlog
          mountPath: /var/log
          readOnly: true
      volumes:
      - name: varlog
        hostPath:
          path: /var/log
Sampling Strategies
At scale, capturing 100% of traces is expensive. OTel supports several sampling approaches:
| Strategy | Use Case |
|---|---|
| Head-based (probability) | Uniform 10% sample at ingress |
| Tail-based (Collector) | Sample 100% of error traces, 1% of success |
| Parent-based | Respect upstream sampling decision |
| Rate-limiting | Fixed N traces/second per service |
Tail-based sampling (in the Collector) is the gold standard — you see all the interesting traces (errors, high latency) while keeping costs manageable.
Cost: OTel vs. Vendor Lock-in
The cost argument for OTel is compelling. A mid-size company sending 500GB/day of telemetry to a SaaS vendor might pay $50K-$200K/year. Self-hosted Grafana LGTM on Kubernetes for the same volume costs roughly $3K-$8K/year in cloud compute.
More importantly: vendor portability. With OTel instrumentation, switching from Datadog to Grafana Cloud is a Collector config change — no code changes.
Conclusion
OpenTelemetry is no longer a bet on the future — it’s the present standard for production observability. The SDK maturity, auto-instrumentation coverage, and Collector flexibility make it the obvious foundation for any greenfield service and a worthwhile migration target for existing systems.
Instrument once. Route anywhere. Sleep better on-call.
What’s your current observability stack? Migrating from a vendor-specific agent to OTel? Share your experience in the comments.
이 글이 도움이 되셨다면 공감 및 광고 클릭을 부탁드립니다 :)